What Silicon Valley Developers Actually Pay For
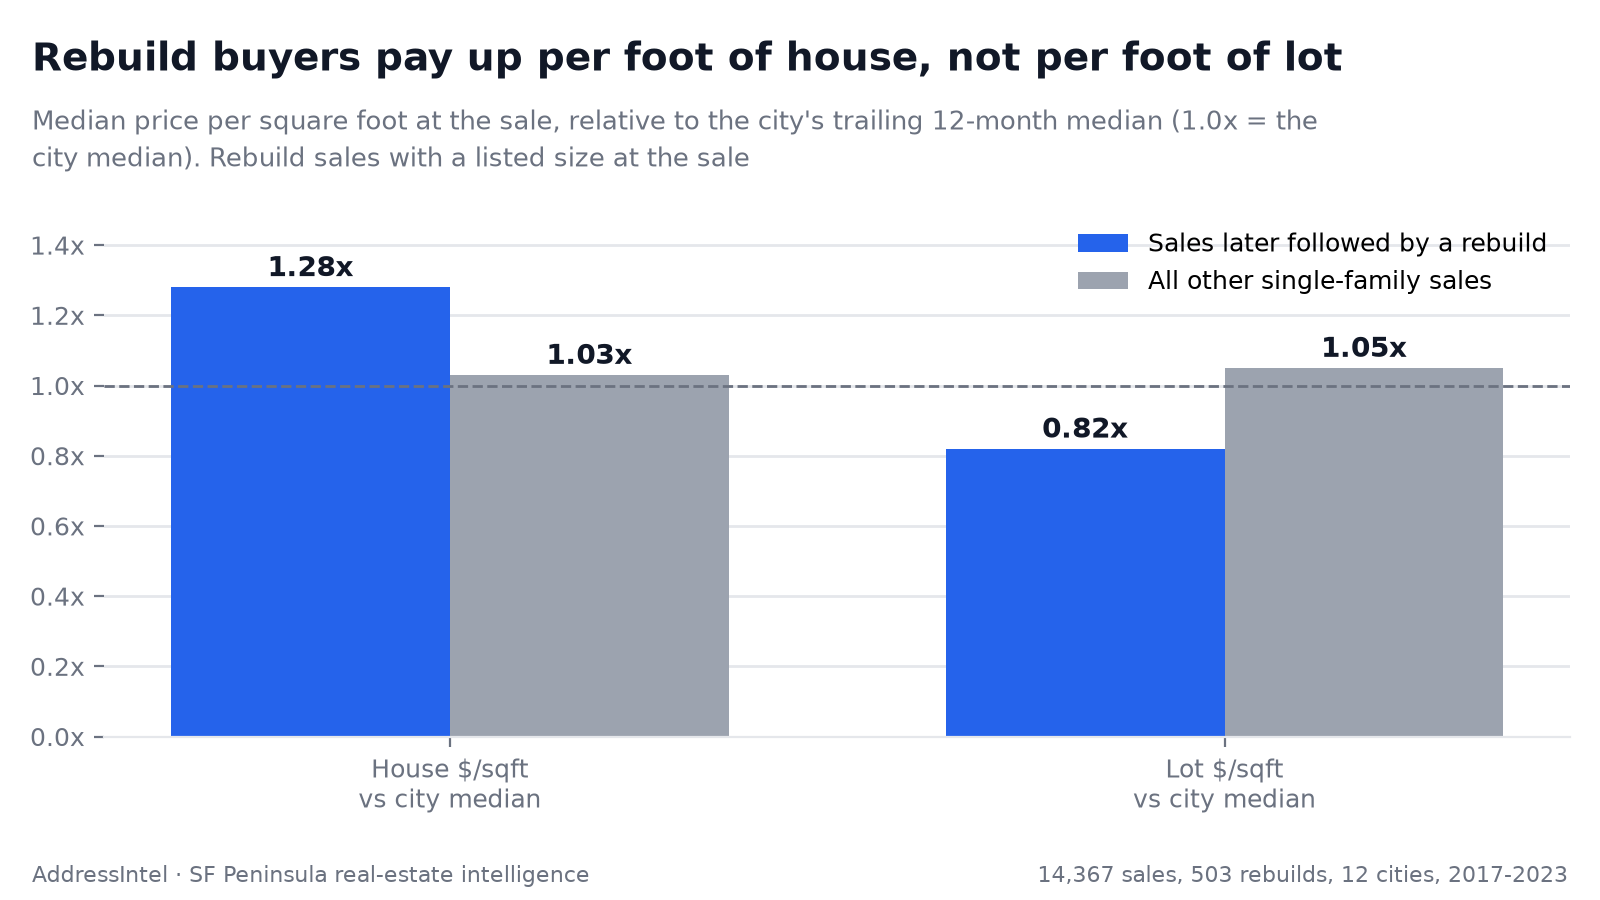
Land. In a backtest of 14,367 house sales, 503 were followed by a new house on the same lot within three years. At the sale, those buyers paid a median 1.28 times the city median price per square foot of house, but only 0.82 times the city median per square foot of lot. Other buyers paid 1.03 times and 1.05 times. A buyer who plans to rebuild pays up per foot of a small house because the lot under it is what they are buying.
They pay up for a small house on a big lot
We took 14,367 house sales we could check against three full years of later permits, in 12 Silicon Valley cities between 2017 and 2023. A sale counts as a rebuild when a new single-family house was permitted on the same lot within three years. 503 qualified. Here is what rebuild buyers paid at the sale (the house figures cover the ones with a listed size), against everyone else, each measured against the city’s trailing 12-month median:
| At the sale (median) | Followed by a rebuild | Other sales |
|---|---|---|
| House size | 1,683 sq ft | 2,074 sq ft |
| Lot size | 10,485 sq ft | 8,088 sq ft |
| FAR used (house / lot) | 0.15 | 0.23 |
| Zoning envelope / house | 2.22x | 1.53x |
| House $/sqft vs city | 1.28x | 1.03x |
| Lot $/sqft vs city | 0.82x | 1.05x |
Smaller houses on bigger lots, bought at a premium per foot of house and a discount per foot of lot. Read per foot of house, these look like overpriced small houses. Read per foot of lot, they look cheap, though part of that is size: a bigger lot almost always sells for less per square foot. The two numbers together are the signature: a price that makes sense for the land, not for the house on it.
A margin screen keeps few of the deals that happen
The usual way to screen a teardown is a pro forma: estimated finished value minus build cost and land price, and keep the deal only if the margin clears a bar such as 15%. We replayed our own model on the 208 of 239 real rebuilds it could price exactly. It said 9% cleared +15%. At constant market prices, 25% actually did.
Land price was not the problem: the model priced the purchases about right. It missed because it had no premium for new construction, a weak fallback for how big the new house would be, and a spread of errors wide enough that too few deals land above any bar. We have since added a 5% premium for new construction and financing over a 33-month hold, the median time these projects took. Measured after financing at an assumed 7% a year, that version flags 5% of the same rebuilds as clearing +15%, against 11% that cleared it at constant market prices after the same financing (an upper bound, since only projects that sold are counted), so fixing the averages did not fix the filter. We did not measure how clean the margin screen’s list is, only how many real deals it keeps. The margin is still worth seeing as a number. As a filter, it drops most of the market.
Zoning headroom works as a band, not a maximum
The second signal is how much more house zoning allows than stands on the lot today. Rebuild rates climb with it, from 0.7% of sales below 1.5 times to 10.4% at 3 to 4 times, and then fall:
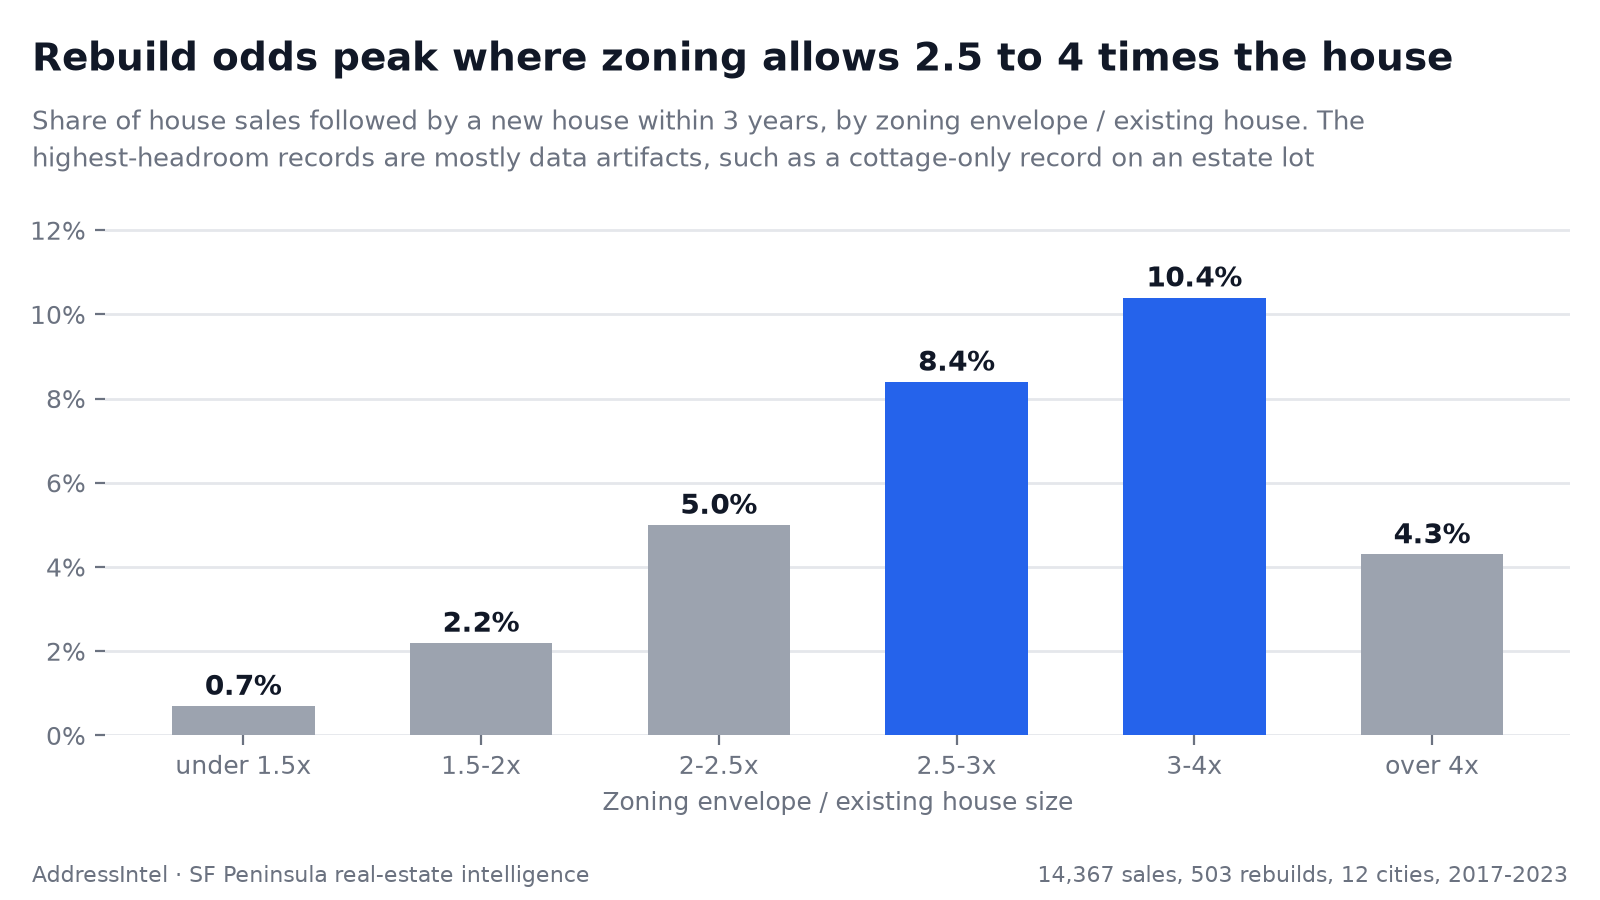
The drop above 4 times is mostly bad records, such as a county record that shows only a cottage on an estate lot. So the useful zone is 2.5 to 4 times, where 9 to 11% of sales led to a rebuild.
Get Teardown Watch in your inbox
Each week, the new San Mateo County listings that match these rules, with the numbers behind every flag. A free section of the Peninsula Plays brief on Substack.
One rule you can run on a listing
Combine how much of the lot the house uses with the price and you get a rule that needs only what a listing shows: the house uses 20% or less of its lot (FAR 0.20 or below) and is priced at 1.4 times or more of the city’s median price per square foot. It does not use the zoning envelope; that is a separate rule.
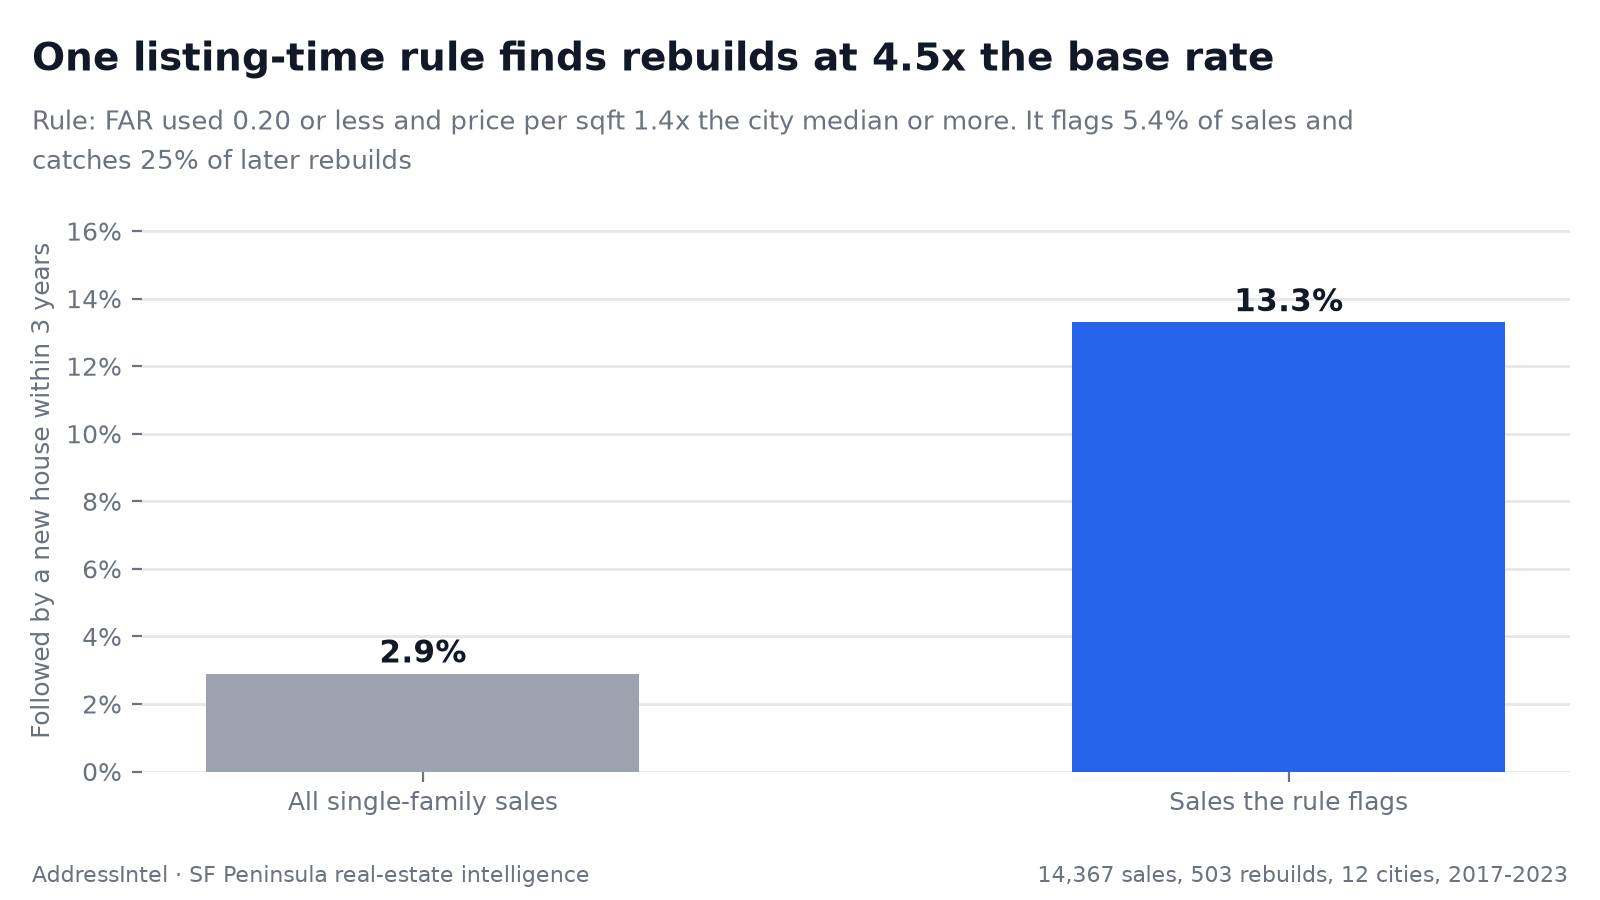
- It flags 5.4% of house sales and catches 25% of the sales later followed by a rebuild.
- 13% of the sales it flags went on to a rebuild, against 2.9% of all sales: a 4.5x lift.
- The lift holds at 4.4x in the cities where our own permit records supply the labels, and 4.2x on the sales where the house’s age is known.
- A tighter version, envelope 2.5 times or more and price 1.2 times or more, flags 3.3% of sales and is right 15% of the time.
The city matters as much as the rule. Rebuilds followed 13% of all Atherton house sales in the backtest and 0.24% of San Mateo’s, so a flag means very different odds in each. The envelope rule shows it: zoning allowing 2 times the house or more was right 37% of the time in Atherton and 0.5% of the time in San Mateo.
What this does not tell you
- It is a lead list. 13% precision means roughly seven of every eight flagged sales did not lead to a rebuild within three years.
- San Mateo County runs a little lower. In the San Mateo County cities, envelope 2 times or more was right 7.2% of the time, against 9.3% across all cities in the same test.
- Run live, it estimates the sale price. The backtest used the actual sale price. On a new listing we use the list price times the city’s usual sale-to-list ratio.
- A rebuild is a rebuild by anyone. An owner who buys and builds their own house counts the same as a developer, which happens more in Atherton, Los Altos Hills and Woodside.
- Off-market buys are invisible to it. 148 of the 503 rebuild purchases had no listing size at the sale, so no size-based rule could flag them.
- It is not fully out of sample. The FAR 0.20 and 1.4x thresholds came from an earlier study whose rebuilds overlap these, and the 2.5 to 4 times band was chosen after looking at this data.
- Some misses are really hits. In cities where the only label source is the state housing report, a rebuild that report missed counts as a miss, so precision there is a floor.
Where we use it: Teardown Watch
We run both rules every day on new San Mateo County house listings. The week’s flags go out as Teardown Watch, a section of the free Peninsula Plays brief, with the numbers that triggered each one. Every flag is logged with its date, so we can later count how many got a new-house permit within three years, the same test as the backtest. Pick your city:
How the backtest was built
Rows are single-family sales of $300,000 or more, in windows where every day from the sale to three years after it is covered by permit data: our own permit records for Mountain View, Saratoga, Menlo Park, Los Gatos and Palo Alto, and the state housing report’s new-house counts for Atherton, Woodside, Los Altos Hills, Monte Sereno, Sunnyvale, San Mateo and San Carlos (Los Gatos uses both). Sale windows run from 2017 at the earliest to September 2023 at the latest, depending on the city. House size at the sale comes from the listing, never from today’s public record, which on a rebuilt lot describes the new house. Prices are compared with each city’s trailing 12-month median, ending before the sale month. Earlier non-rebuild sales came from a 1-in-60 random sample and are weighted to match, so the 14,367 sales stand for 17,199.
Frequently Asked Questions
What do Silicon Valley developers pay for when they buy a teardown?
The land. Across the house sales that were followed by a new house within three years and had a listed size at the sale, buyers paid a median 1.28 times the city median price per square foot of house, against 1.03 times for other sales, but only 0.82 times the city median per square foot of lot, against 1.05 times. They paid up per foot of a small house because they were buying the lot under it.
Can you tell a developer buy from the listing?
Partly. In the backtest, a sale where the house used 20% or less of its lot (FAR 0.20 or below) and the price was 1.4 times or more of the city median per square foot flagged 5.4% of sales and caught 25% of the sales later followed by a rebuild. 13% of the sales it flagged went on to a rebuild, 4.5 times the 2.9% rate for all sales. That makes it a lead list, not a prediction: most flags do not become rebuilds.
Why not just screen listings on a margin target?
Because a pro forma ranks real deals poorly. Replayed on the 208 of 239 real rebuilds it could price exactly, our own model said 9% cleared a +15% margin; at constant market prices, 25% actually did. The model was not wrong about land prices. It had no premium for new construction and a weak build-size fallback, and it put too few projects in the tail above any bar. We have since added a 5% new-construction premium and financing over a 33-month hold. On the same 208 rebuilds that version flags 5% as clearing +15% after financing at an assumed 7%, against 11% that cleared it at constant market prices after the same financing. Both are shares of this sample, not of the market, and the realized share is an upper bound because only projects that sold are counted. A margin is still worth showing as a number. As a filter, it drops most real deals.
Does a bigger zoning envelope always mean a likelier rebuild?
No. Rebuild rates climb from 0.7% of sales where zoning allows under 1.5 times the existing house to 10.4% where it allows 3 to 4 times, then fall to 4.3% above 4 times. The highest-headroom records are mostly data artifacts, such as a cottage-only record on an estate lot, so headroom works as a band, not a maximum.